pacman::p_load(dplyr, tidyverse, DT, ggplot2, ggiraph,
               ggstatsplot, patchwork, plotly, gganimate,
ggthemes, corrplot, heatmaply,lubridate,scales,ggrepel,ggpubr)Take-home Exercise 3
1.0 Overview
This take-home exercise requires the use of appropriate analytical visualization techniques to identify significant patterns in the resale prices of public housing property in Singapore by residential towns and estates. The focus should be on 3-ROOM, 4-ROOM, and 5-ROOM housing types, and the study period should be on 2022. Students are encouraged to use interactive techniques to enhance user and data discovery experiences.
1.1 Loading Libraries
1.2 Reading Dataset
resale_data <- read_csv("Data/resale-flat-prices-based-on-registration-date-from-jan-2017-onwards.csv")

DT::datatable(head(resale_data,20))
he month column is in the format “YYYY-MM”, we can convert it to a date format using:
resale_data <- resale_data %>%
  mutate(month = as.Date(paste0(month, "-01"), format = "%Y-%m-%d"))
This code adds “-01” to the end of each value in the month column to create a complete date string in the format “YYYY-MM-DD”, and then converts the resulting string to a date format using the as.Date function with the “%Y-%m-%d” format string.
resale_345room_2022 <- resale_data %>%
  filter(flat_type %in% c("3 ROOM", "4 ROOM", "5 ROOM"),
         year(month) == 2022) %>%
  mutate("unit_price_sqm" = resale_price/floor_area_sqm)
In this case, we use the same %in% operator as before to filter out rows where the flat_type column is either “3 ROOM”, “4 ROOM” or “5 ROOM”. Additionally, we use the as.Date function to convert the month column to a date format, and then use the year function to extract the year from the dates. We then use the logical operator == to specify that we only want rows where the year is equal to 2022.
DT::datatable(head(resale_345room_2022))2.0 Data Analysis and Visualizations
2.1 Average Resale Price Trend by Flat Type
# Group data by flat type
resale_345room_2022_grouped <- resale_345room_2022 %>%
  group_by(flat_type, month) %>%
  summarise(resale_price = mean(resale_price)/1000)

# Plot monthly trend by flat type
ggplot(resale_345room_2022_grouped, aes(x = month, y = resale_price, color = flat_type)) +
  geom_line() +
  scale_x_date(date_labels = "%b", date_breaks = "1 months") +
  labs(x = "Month", y = "Resale Price (SGD, thousands)", color = "Flat Type",title = "Monthly Resale Price Trend by Flat Type (2022)") +
  theme_bw()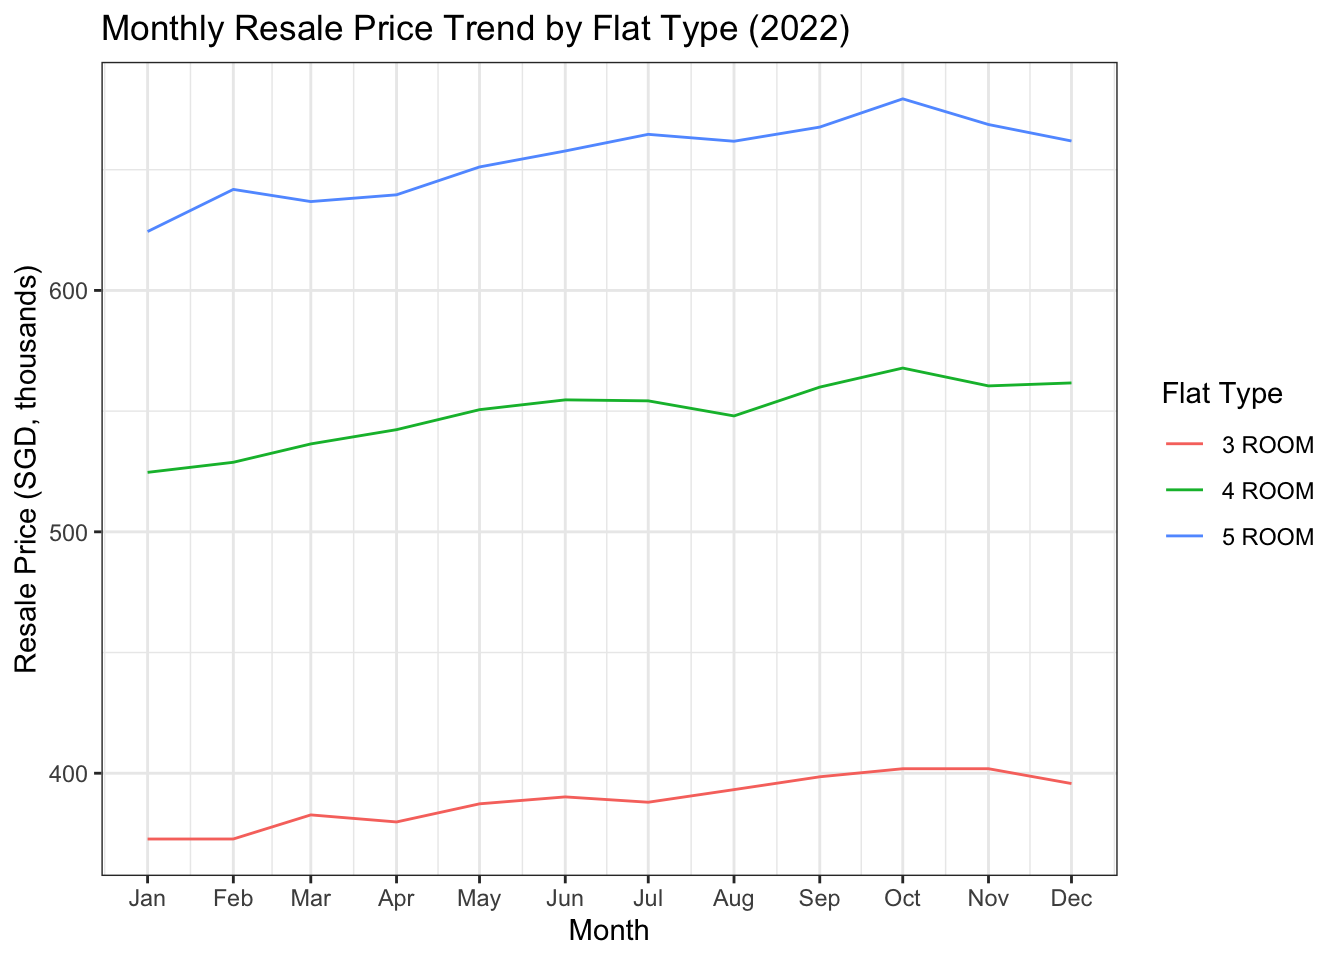
Analytic insights: This line chart displays the average resale price trends for three different types of public housing flats in Singapore (3-ROOM, 4-ROOM, and 5-ROOM) during the year 2022. The chart indicates that 3-ROOM flats generally had the lowest average resale prices, while 5-ROOM flats had the highest. All three types of flats experienced an upward trend in average resale prices throughout the year, with some fluctuations.
2.2 Average Unit Price Per Sqm Trend by Flat Type
# Group the data by flat type and month, and calculate the average unit resale price
resale_avg <- resale_345room_2022 %>%
  group_by(flat_type, month) %>%
  summarise(avg_resale_price = mean(resale_price)/mean(floor_area_sqm))

# Plot the line chart with dynamic tooltips using ggplot and plotly
p <- ggplot(resale_avg, aes(x = month, y = avg_resale_price, color = flat_type, group = flat_type)) +
  geom_line() +
  scale_x_date(date_labels = "%b", date_breaks = "1 months") +
  scale_y_continuous(labels = function(x) paste0(x/1000, "k")) +
  labs(x = "Month", y = "Unit Price", title = "Average Unit Resale Price Trend by Flat Type (2022)") +
  theme_bw()

ggplotly(p, tooltip = c("month", "avg_resale_price"))
Analytic insights: The line chart of the unit price per square meter of public housing in Singapore shows that there is a clear upward trend for all three flat types (3-room, 4-room, and 5-room) from January to September 2022. The average unit price for 4-room flats is the highest among the three types, followed by 3-room and 5-room flats. Additionally, there is a significant increase in unit price from August to October for all three flat types. These insights suggest that the public housing market in Singapore is experiencing a general upward trend in unit price, with larger flats commanding a lower unit price.
2.3 Visualizing the uncertainty of point estimates: ggplot2 methods
my_sum <- resale_345room_2022 %>%
  group_by(flat_type) %>%
  summarise(
    n=n(),
    mean=mean(unit_price_sqm),
    sd=sd(unit_price_sqm)
    ) %>%
mutate(se=sd/sqrt(n-1))ggplot(my_sum) +
geom_errorbar(
aes(x=flat_type,
ymin=mean-se,
ymax=mean+se),
width=0.2,
colour="black",
alpha=0.9,
size=0.5) +
geom_point(aes
(x=flat_type,
y=mean),
stat="identity",
color="red",
size = 1.5,
alpha=1) +
ggtitle("Standard error of mean
unit price by flat type")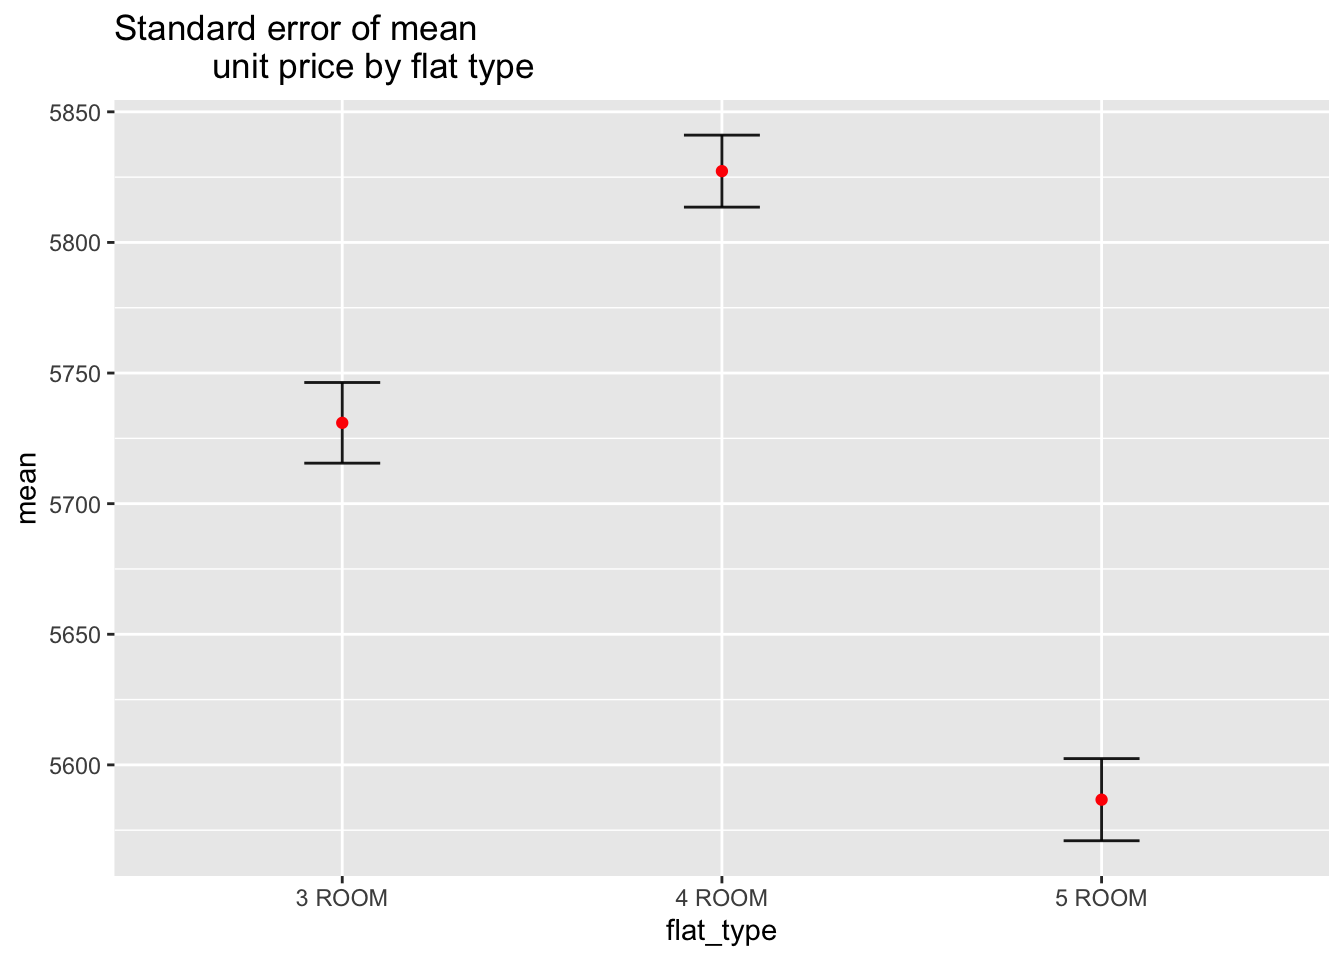
2.4 The Distribution of Lease Commence Date for 3-Room (2022)
resale_3room <- resale_345room_2022 %>%
filter(flat_type == "3 ROOM")
gghistostats(
data = resale_3room ,
x = lease_commence_date,
type = "bayes",
test.value = 60,
xlab = "lease commence date",
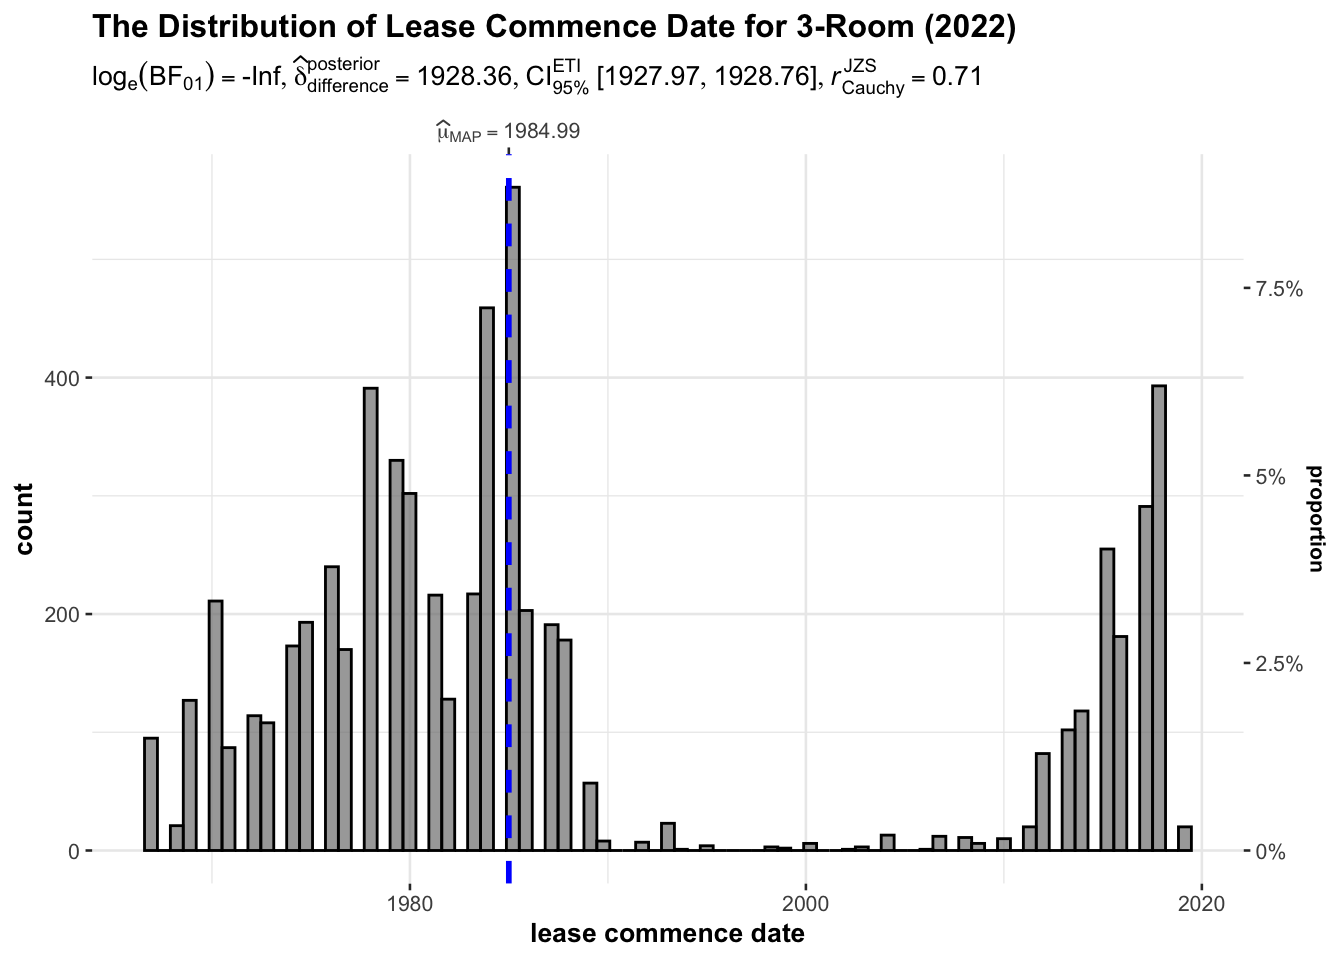
title="The Distribution of Lease Commence Date for 3-Room (2022)",
)
resale_4room <- resale_345room_2022 %>%
filter(flat_type == "4 ROOM")
gghistostats(
data = resale_4room ,
x = lease_commence_date,
type = "bayes",
test.value = 60,
xlab = "lease commence date",
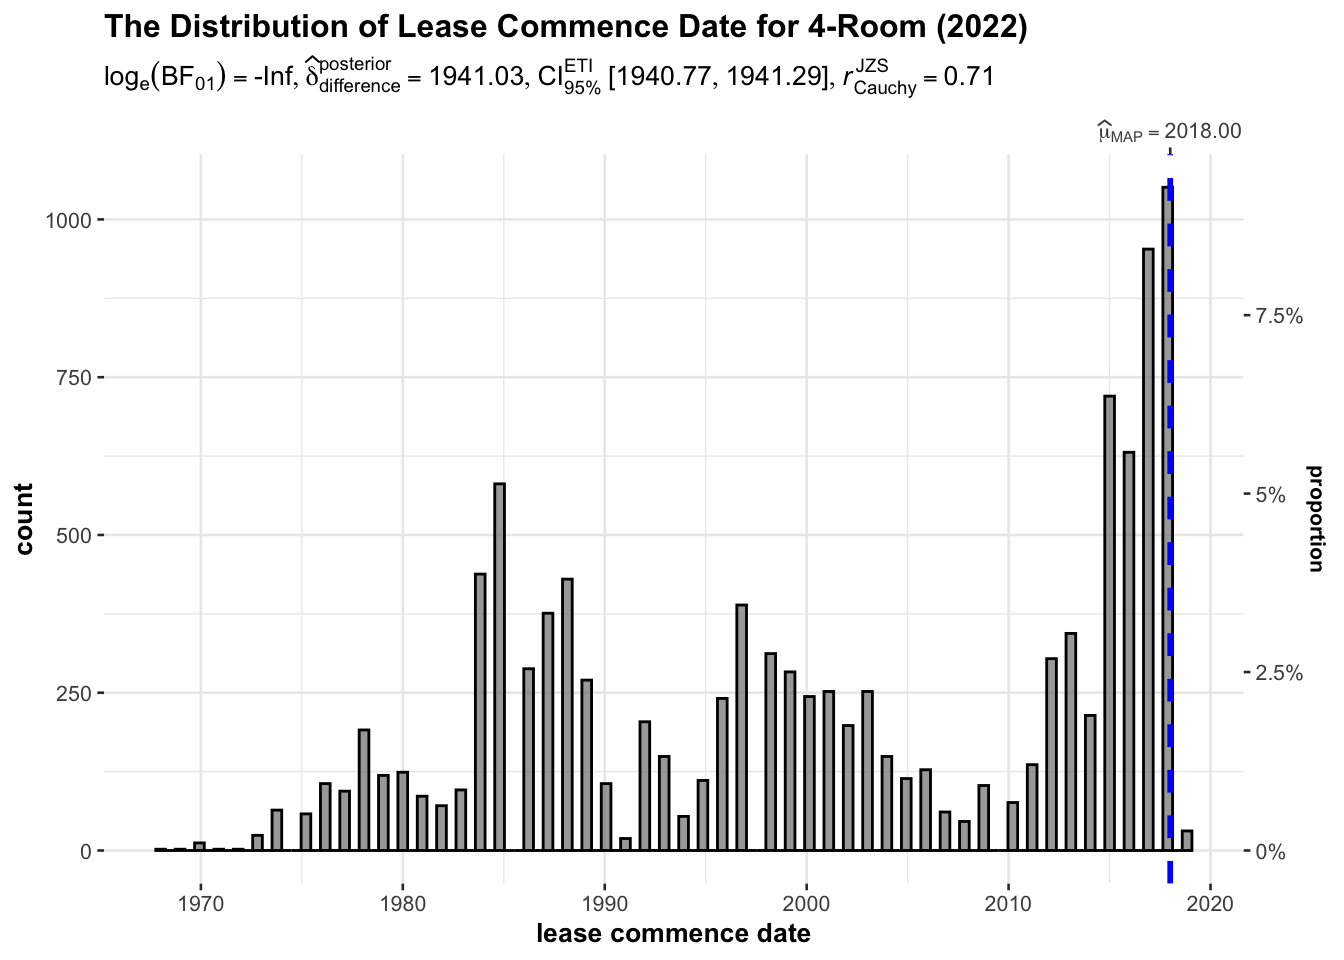
title="The Distribution of Lease Commence Date for 4-Room (2022)",
)
resale_5room <- resale_345room_2022  %>%
  filter(flat_type == "5 ROOM")

gghistostats(
  data = resale_5room ,
  x = lease_commence_date,
  type = "bayes",
  test.value = 60,
  xlab = "lease commence date",
  title="The Distribution of Lease Commence Date for 5-Room (2022)",
)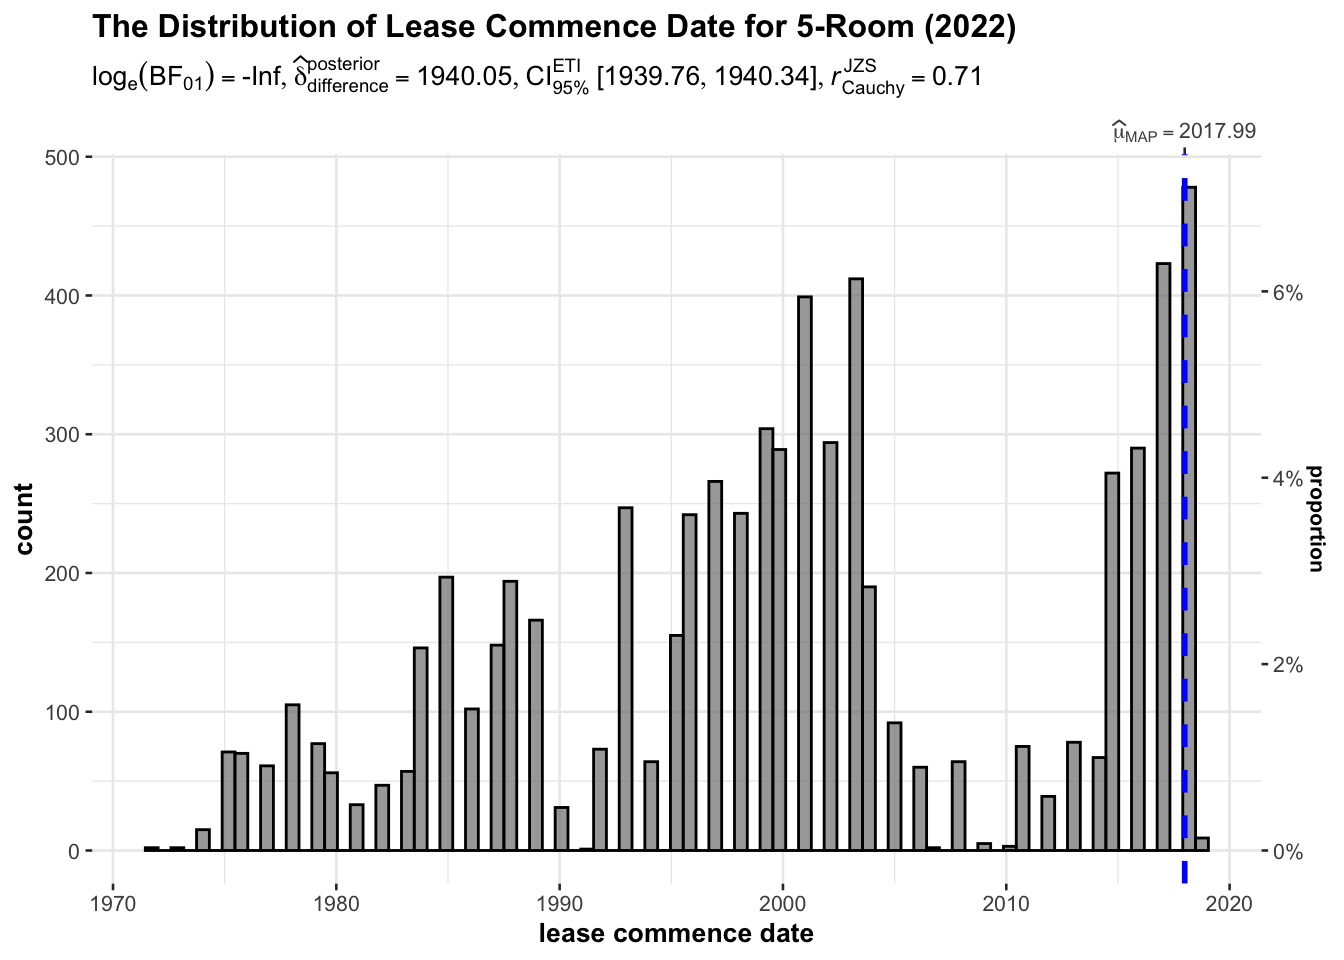
Analytic insights: When analyzing the distribution of lease commencement dates for 3 room, 4 room, and 5 room HDB units, it was found that the majority of three-room second-hand HDB units had leases that commenced between 1970 and 1986, with the highest number of units having leases that commenced in 1984. The number of second-hand HDB units with leases commencing between 1986 and 2010 was very low. The lease commencement dates for second-hand 4 room and 5 room HDB units were relatively stable from 1970 to 2010 and began to increase in 2021, reaching a peak in 2018. However, due to the COVID-19 pandemic, this number dropped sharply, which also reflects the decline in HDB construction during the pandemic.
2.5 One-way ANOVA test on Unit Price / sqm by Flat Type
p <- ggbetweenstats(
  data = resale_345room_2022,
  x = flat_type,
  y = unit_price_sqm,
  type = "p",
  mean.ci = TRUE,
  pairwise.comparisons = TRUE,
  pairwise.display = "s",
  p.adjust.method = "fdr",
  messages = FALSE
)

p + labs(title = "One-way ANOVA test on Unit Price / sqm by Flat Type",
         y = "Unit Price / sqm",
         x = "Flat Type")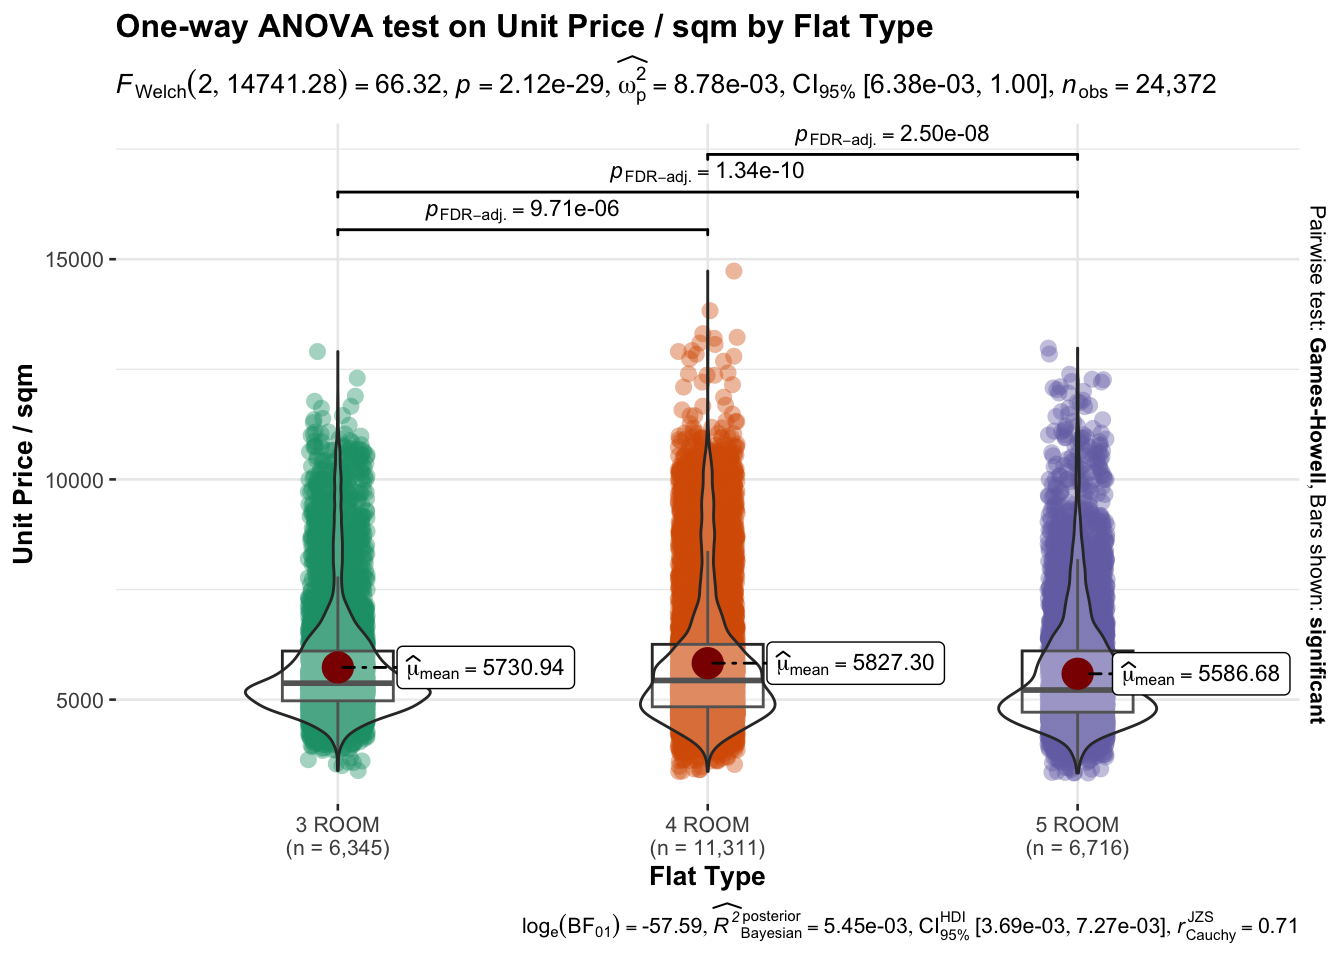
Insights: This plot shows the results of a one-way ANOVA test on the unit price per square meter by flat type using the resale dataset. The x-axis shows the flat type, and the y-axis shows the unit price per square meter. The plot provides information about the mean and confidence intervals of the unit price per square meter for each flat type. The blue lines connecting the mean values show the significant pairwise comparisons between flat types, with the label indicating which flat types are significantly different from each other. The plot suggests that the unit price per square meter is significantly different among the different flat types, with 4-room and 5-room flats having the highest unit prices, followed by 3-room flats. This information can be used by potential buyers and sellers of HDB flats to gain insights into the current market trends and make informed decisions.
2.6 Resale Price by Town and Flat Type
ggplot(resale_345room_2022, aes(x=town, y=resale_price/1000, fill=flat_type)) +
  geom_boxplot() +
  xlab("Town") +
  ylab("Resale Price (in '000s')") +
  scale_fill_manual(values=c("blue", "red", "green", "orange", "purple", "pink")) +
  theme(axis.text.x = element_text(angle = 90, hjust = 1, vjust = 0.5),
        plot.margin = unit(c(1, 5, 1, 1), "cm"),
        axis.title.x = element_text(size = 18),
        axis.title.y = element_text(size = 18),
        legend.title = element_blank(),
        legend.text = element_text(size = 18)) +
  labs(title = "Resale Price by Town and Flat Type") +
  scale_y_continuous(labels = function(x) paste0(x, "k")) +
  coord_cartesian(clip = "off", ylim = c(0, 1400)) +
  theme(plot.title = element_text(size = 18, face = "bold"),
        axis.text.y = element_text(size = 18),
        legend.position = "bottom",
        legend.box = "horizontal",
        legend.margin = margin(t = 0, r = 0, b = 0, l = 0)
) 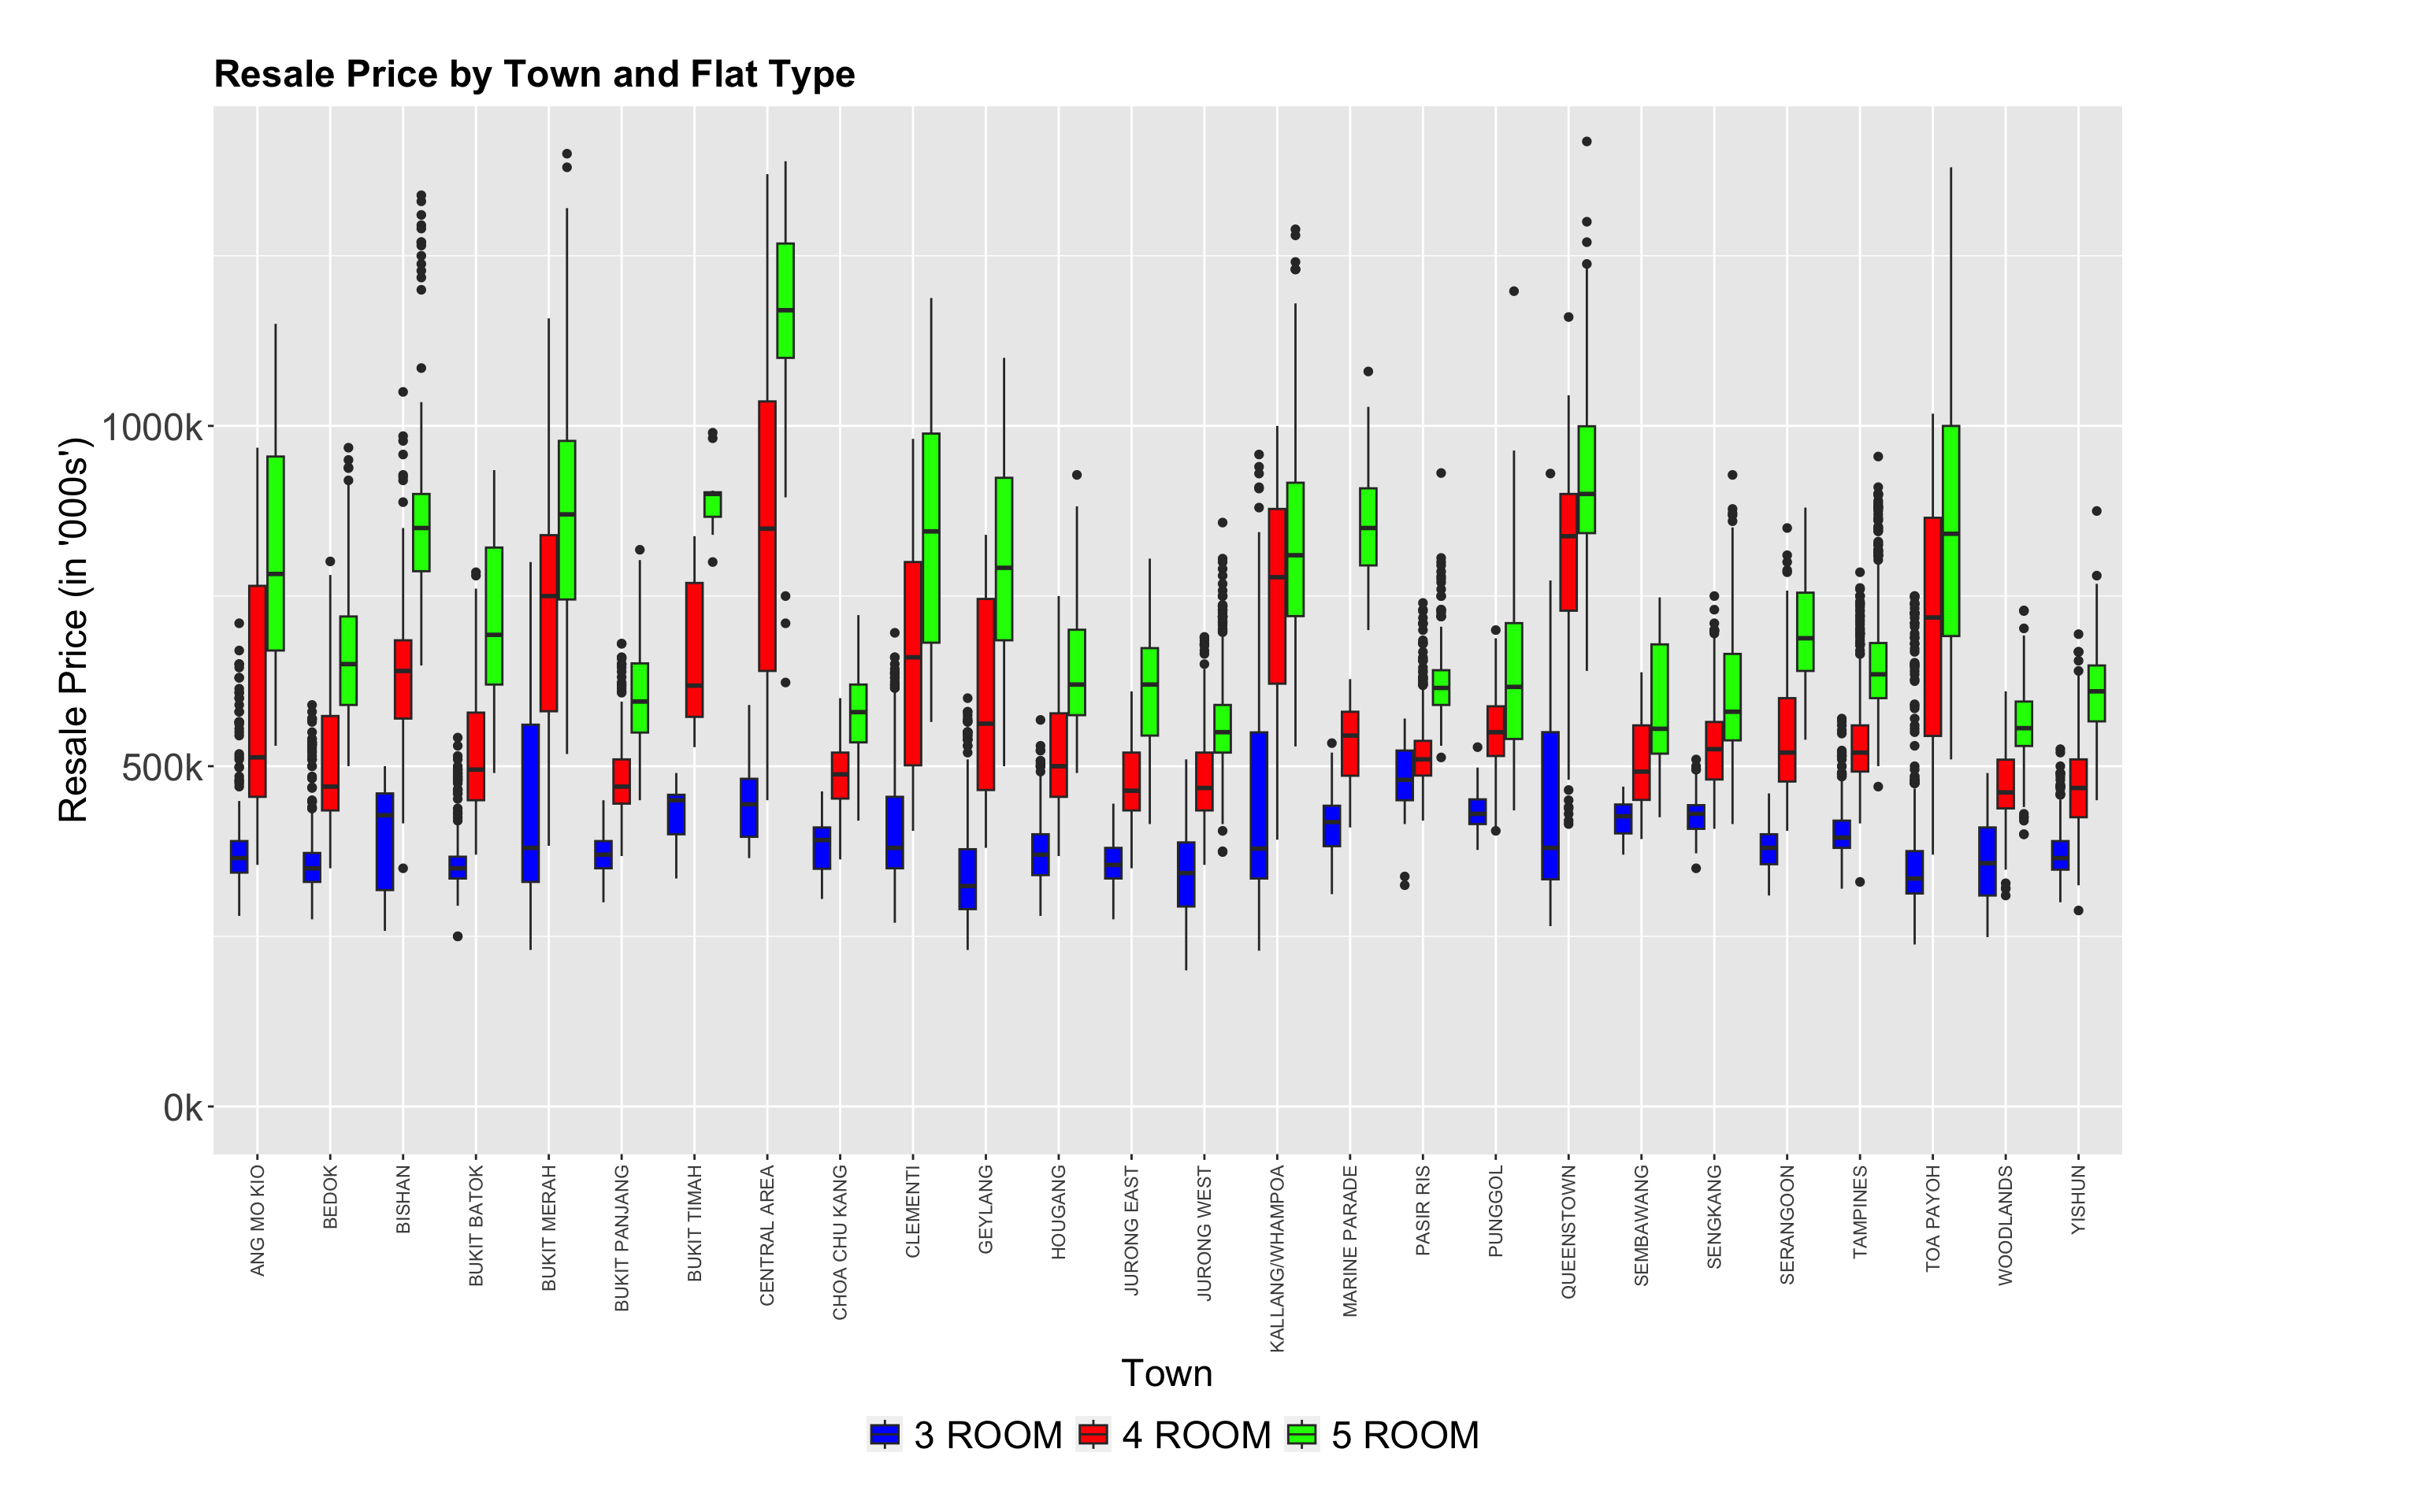
Insights: The chart shows the distribution of resale flat prices across different towns in Singapore, separated by flat type.
The first thing we can observe is that resale prices are generally higher for larger flats, as expected. The prices of 5-room and executive flats are consistently higher across all towns than 3-room and 4-room flats.
We can also see that the range of prices varies widely across different towns, even for the same flat type. For example, in the town of Bukit Merah, the resale price for a 3-room flat ranges from about SGD 200,000 to over SGD 700,000, while in Jurong West, the price range is from about SGD 100,000 to just over SGD 500,000. This suggests that location is an important factor in determining resale flat prices.
Finally, we can observe that there are some towns where a particular flat type is more dominant than others. For example, in Woodlands, 4-room flats make up the majority of the resale market, while in Marine Parade, executive flats are the most common. This could be useful information for people who are looking to buy or sell a resale flat in a particular town.
3.0 Conclusions and Takeaways
Conclusions
The dataset on resale flat prices in Singapore provides valuable insights on the factors that influence the market. The box plot chart revealed that flat type and location play a significant role in determining resale prices. Larger flats, such as 5-room and executive flats, are consistently more expensive than 3-room and 4-room flats. Moreover, the resale price range varies widely across different towns, highlighting the importance of location in determining flat prices. The data also shows that the dominance of a particular flat type varies from town to town. The analysis of lease commence dates for second-hand flats further reveals interesting trends. There was a noticeable rise in the lease commence dates for 4 and 5 room flats in 2021, with a sharp decline during the COVID-19 pandemic. This indicates a decline in the construction of new homes during the pandemic. Overall, these insights are useful for buyers and sellers looking to make informed decisions in the Singapore resale flat market.
Key Takeaways
Filters and aggregation are important tools for analyzing and summarizing data frames.
Box plots can be used to visualize the distribution of data and highlight the range of uncertain values.